Sentry for OnBase™
Overview
Sentry for OnBase is a tool that allows business users to create rules that monitor user activity within their organization. It provides easy to view dashboards and alerts that indicate when activity falls outside of the bounds of what is expected of users.
Sentry is an application separate from OnBase that runs as an agent and communicates both with configuration in the cloud as well as local database tables in a separate schema within the OnBase database. Sentry has the ability to be configured against multiple OnBase datasources and managed through a single application. In this way, customers can manage rules across their development, test, and production environments, or if they have multiple production environments, these rules can be easily managed.
Jobs
Sentry operates on the concept of alarms that can be configured through jobs that can run periodically. Jobs can be configured at various intervals including:
- Intervals of every
minutes - Intervals of a specific time once a day
- Intervals of a specific time during the week
For example, a job can be configured to run every 15 minutes, at 8am every day, or at 8a on every Friday.
Alarms
One or more alarms can be configured to execute when the schedule for a job is triggered. Alarms can be configured to target a specific user group, user, or action or any and all user groups, users, and actions. Alarms evaluate a preconfigured condition that can be evaluated within the context of the current user activity or against historic user activity. For current user activity a period is configured that indicates what current activity would be. For example, a user viewing documents within the last two days. For historic user activity, a user statistics table is employed that is caculated periodically and typically uses a larger sample period of user activity. For example, historic user activity may be calculated for the previous 90 days, and then compared to recent user activity over the last two days.
Conditions include testing recent or historic activity either stand alone or in comparisong to one another. Including:
- Recent or historic averages, counts, percentages, or maximum in the aggregate.
- Recent or historic hourly averages, counts, or percentages (no maximum at the hourly level)
- Comparisons of recent or historic hourly averages, counts, or percentages by hour
Conditions are evaluated on a per user basis, so when evaluating recent or historic activity either alone or in combination, the activity is evaluated at the user level.
A lightweight expression can be configured that allows for flexible combinations of conditions.
Here are some examples:
Detects if the average recent user activity is greater than 10% of the historic average for that user.
recent.Average > 1.1 * historic.Average
Detects if the average recent user activity is greater than 10% of the historic maximum for any given day during the period.
recent.Average > 1.1 * historic.Max
Dectects if there is no user activity.
recent.Count == 0
Detects if recent activity occurred past 6pm. The hour variable indicates the hour of the day ranging from 0 to 23.
recent.HourlyCount("(hour > 18) && (count > 0)")
Detects if any recent activity is greater than historic activity per hour. first and second represent the value for the recent and historic averages since recent is being compared to historic. This can be written as historic as compared to recent in which case, first would represent the historic average and second would represent the recent average.
recent.CompareHourlyAverages(historic,"(first > second)")
As previously mentioned, the conditions are evaluated under the context of user groups, users, and actions. A single alarm with a single condition can be associated with either multiple user groups, users, or actions, or all user groups, users, or actions represented by an asterisk (*) respectively.
The following image depicts the alarms table.
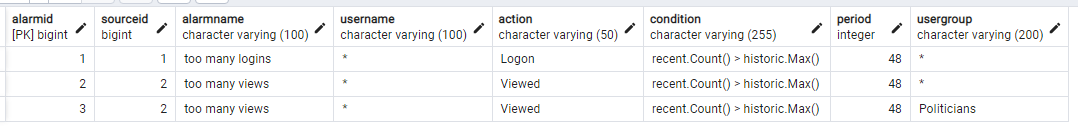
We can see here there is a username, usergroup, and action column. These columns are capable of accepting either an asterisk (*) indicating all, respective users, user groups, or actions, or the columns can accept a column delimited list of user names, group names, or actions.
Notifications
If any alarms within a notification are triggered, an e-mail message is sent to the e-mail address for the configured notification on the job. The e-mail contains details about the alarms that have been triggered.
If an exception occurs during the course of the evaluation of any given alarm, the exception is included in the notification. This allows the administrator to quickly see that there is a potential misconfiguration or other error that is preventing an alarm from being evaluated.
Database Tables
Sentry has one schema that is installed within the OnBase database. The sentry schema is created within the OnBase database and contains information specific to the OnBase database including statistical information from the OnBase system that is used when evaluating metrics.
Sentry creates a number of objects within the OnBase database under the sentry database schema. These include two tables and two views.
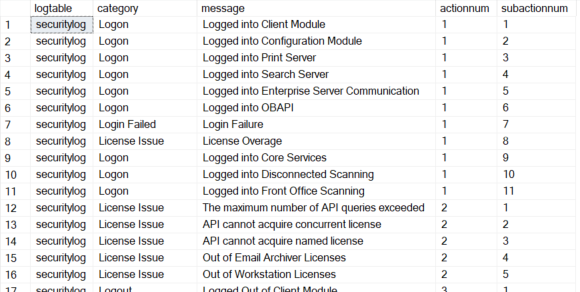
The sentry.logtext table is a lookup table that stores lookup values that join from either the securitylog or the transactionxlog table. This is to simplify the concept of having both an action and a subaction in the OnBase log tables. The action and subaction are mapped into a single action string in the resultant view. For example a securitylog action of 1 and a subaction of 1 indicate a Logon operation.
Example of sentry.logtexts
The sentry.securitylogview and sentry.transactionxlogview are two views that are created that join to the hsi.securitylog and hsi.transactionxlog tables respectively. These views create a friendly version of the log tables that indicate string-based actions along with the username associated with the respective user ids in the log table.
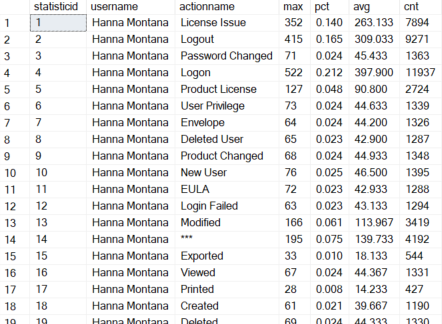
Finally, a statistics table called sentry.userstatisticsbyhour is created in the OnBase database. This table is populated periodically by command line via the agent and contains statistics by user, by action for a given period of time. Stastistics include the following (by user by action):
- User Name
- Action Name
- Total count of actions for the given period
- Daily average of an action for the given period
- Daily maximum of an action for the given period
- Percentage of action across all actions for a user for the given period
- 24 columns each representing an hour of the day with total count of actions within that hour
- 24 columns each representting an hour of the day with the daily average of the action within that hour
- 24 columns each representing an hour of the day with the percentage of activity for that action across the hours of the day
Example of Overall Aggregates
Example of Hourly Aggregates
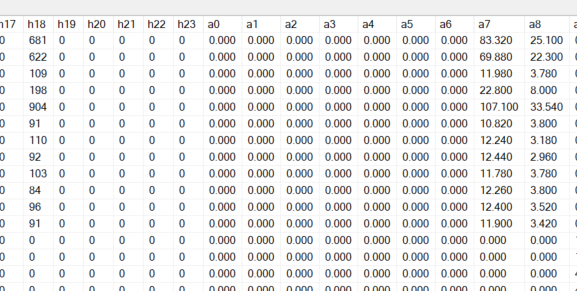
Note that the hourly columns are prefixed by H, A, and P followed by a 0-23 representing each of the 24 hours of the day. Values in the H columns represent the counts, while values in the A and P columns represent the hourly averages and percentages respectively.
Datasources
Datasources represent a distinct OnBase instance. For example, within a given customer, development, test and production, or across customers, multiple production systems. Each datasource has a name and a configured connection string to connect to that instance.
Sources
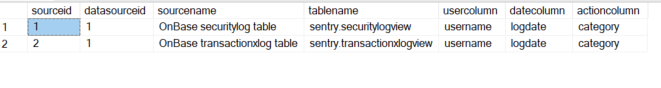
Different from datasources, sources are tables (or views) within the OnBase database that serve as sources of stastitics. Sources are defined by having a user name column, an action name column, and a log date column defined in the sources table, along with the respective table. Sentry actually uses the Sentry created views mentioned earlier to facilitate this. This allows Sentry to theoretically work with any table (or view) that has these three columns, as the queries used to generate statistics are built dynamically off of these three columns.
Example of sentry.sources
Command Line Interface
Sentry has a command line interface to faciliate a number of operations for the purposes of automation and general maintenance so that the administratro does not have to go directly to the database.
The command line interface consists of the following commands:
sentrycli.exe add [datasource | notification | job | alarm]
sentrycli.exe add datasource --name --connectstring
sentrycli.exe add notification --name --emailaddress
sentrycli.exe add job --name --frequencytype --every --attime --onday --notificationidsentrycli.exe add alarm --sourceid --name --username --action --period --condition
sentrycli.exe add alarm --sourceid --name --username --usergroup --action --period --condition --jobid
sentrycli.exe login --emailaddress <address> --password <password>
sentrycli.exe poll
sentrycli.exe populate --table [securitylog | transactionxlog] --count <count> --dayspan <dayspan>
sentrycli.exe register
sentrycli.exe sendconfiguration [all] --emailaddress <addr>
sentrycli.exe show [sources | alarms | jobs | notifications | statistics | datasources | joblog]
sentrycli.exe test [alarms | jobs | notifications]
sentrycli.exe test alarms [--all | --alarmid <id>]
sentrycli.exe test jobs [--all | --jobid <id>]
sentrycli.exe updatestatistics --days <days>
Login
sentrycli.exe login --emailaddress <address> --password <password>
The login command is required for all operations within the command line interface. A valid user account with the Evolution platform is required. See Privileges for the required privileges to perform various operations. Note that once you are logged in, the console stays logged in with that account for subsequent usage. The credentials are stored in a .credentials file the AppData folder for the current roaming user. The credentials are stored in the form of an access token and do not expose the password that were used when logging into the console. If the token expires, the user would be required to log in to the console again to perform further operations.
Register
sentrycli.exe register
The register command is required before running any jobs. This command activates the entitlement to Sentry for the logged in user's organization. The logged in user must have rights to register a product for this operation to succeed. Once the operation is successful the activation is stored in a .registration file in the AppData folder for the current roaming user. That file comtains the activation code that the executable uses to periodically verify that the entitlement is still active. It also includes an access token with limited rights to check only for entitlements. The checking of entitlements does not occur through the currently logged in user account.
Populate
sentrycli.exe populate --table [securitylog | transactionxlog] --count <count> --dayspan <dayspan>
The populate command is used for testing purposes and populates either the securitylog or transactionlog table indicated by the --table parameter. The --count parameter indicates the number of entries that should be made into the desingated table and the --dayspan parameter indicates over how many days those entries should be spread.
WARNING This command should not be used against a production database. It should only be used for testing purposes against development or pre-production systems. This command manufactures artificial activity with existing users from the user account table.
Show
sentrycli.exe show [sources | alarms | jobs | notifications | statistics | datasources | joblog]
The show command is used to list a number of tables including both configuration tables and instance tables.
Configuration tables consist of:
- datasources
- sources
- jobs
- alarms
- notifications
Statistics are designated by the statistics parameter and list the currenly calculated statistics stored in sentry.userstatisticsbyhour.
The joblog parameter lists the job activity for all triggered jobs. This includes:
- Name of the job
- The date and time the job was triggered
- The duration of the job (in seconds)
- Who was notified upon job completion
- Whether or not the job raised an alarm
- The datasource name for which the job was triggered
Add
sentrycli.exe add datasource --name --connectstring
sentrycli.exe add notification --name --emailaddress
sentrycli.exe add job --name --frequencytype --every --attime --onday --notificationid
sentrycli.exe add alarm --sourceid --name --username --action --period --condition --jobid
The add command is used to add configuration items. Including datasources, notifications, jobs, and alarms.
These commands may be useful for automation and are also available through the Sentry web interface and Sentry web api.
Update Statistics
sentrycli.exe updatestatistics --days <days>
The updatestatistics command recalculates the statistics for a given period and stores them in the sentry.userstatisticsbyhour table. The --days parameter indicates how far back the statistics should be calculated, for example, 30, 60, 90 days, and so on.
The command line interface is currently the only way to update statistics. Statistics must be generated before any jobs can be run.
Poll
sentrycli.exe poll
The poll command runs the scheduler. The scheduler monitors the configured jobs and runs the respective job when its configured time has occurred. The scheduler runs jobs across all data sources and upon job completion jobs are written to the sentry.joblog table.
Test
sentrycli.exe test [alarms | jobs | notifications]
sentrycli.exe test alarms [--all | --alarmid <id>]
sentrycli.exe test jobs [--all | --jobid <id>]
The test command allows testing of alarms and jobs without requiring the scheduler and without generating a notification. Tests can be run by the --all parameter or by the --jobid or --alarmid parameters for jobs and alarms respectively.
Privileges
Any valid Evolution user can log in to the Sentry console via the login command. The various privileges are checked at the individual commands (poll, updatestatistics, etc.)
You should always follow a least privileged approach to running the console. For example, to register a product you would need a user such as an organization administrator to register the console. Additionally, another user with rights to configure Sentry could be used to configure the product and test the various alarms and jobs. At runtime however, you would use a user with rights to only run the jobs themselves.
| Command | Privileges |
|---|---|
| login | Any valid Evolution user |
| register | A user with the Evolution Org.RegisterProducts privilege |
| poll | A user with the Sentry Sentry.RunJobs privilege |
| add | A user with the Sentry Sentry.Configure privilege |
| show | A user with the Sentry Sentry.Configure privilege. One exception is that job logs can be viewed by a user with the Sentry.ViewJobLogs privilege. |
| updatestatistics | A user with the Sentry Sentry.UpdateStatistics privilege |
| test | A user with the Sentry Sentry.Configure privilege |
| populate | A user with the Sentry Sentry.Configure privilege |
Rather than configure users with each of these privileges separately, there are built in roles that encapsulate a number of these privileges.
| Roles | Privileges |
|---|---|
| Org.Admin | Org.RegisterProducts |
| Sentry.Admin | Sentry.RunJobs, Sentry.Configure, Sentry.UpdateStatistics |
| Sentry.JobAdmin | Sentry.RunJobs, Sentry.ViewJobLogs |
In addition to the above user privileges, the Sentry application itself has three privileges that are granted upon activation. These include:
- App.SendEmails
- App.LogMetrics
- App.CheckEntitlements
Architecture
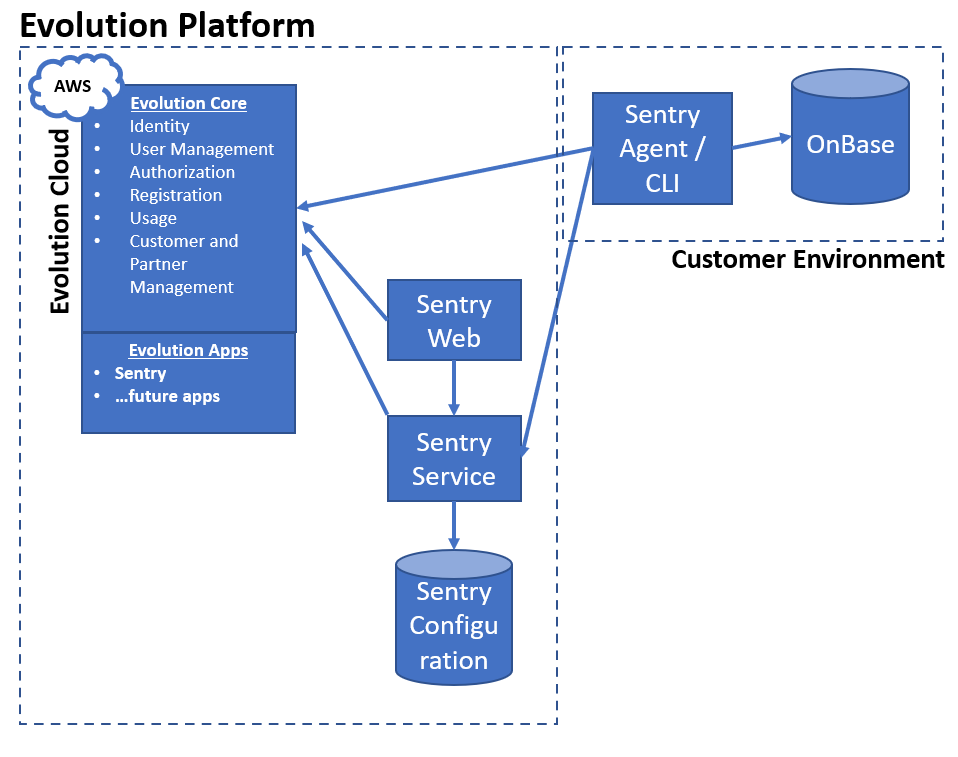
The current architecture is depicted in the diagram immediately below. The primary application consists of a console application which also serves as an agent sentrycli.exe that performs the the runtime tasks against the OnBase database such as querying the log tables and testing for alarm conditions. The console application is compatible with both Linux and Windows and can also be hosted via Docker images (preferably on Linux). The console communicates with the OnBase database directly as well as the Sentry configuration via the Sentry web api. The Sentry configuration is hosted as an Evolution application within AWS. In this way the Sentry application leveerages the configuration within the cloud but also isolates database access to the on-premise environment.
Sentry creates tables within the OnBase database under the schema name sentry. Additionally, the Evolution subsystem creates an upgrade tracking table located in the public schema for the respective database engine. In the case of Microsoft SQL Server, it would be dbo and for PostgreSQL it would be public.
The application also communicates with the Evolution Cloud to authenticate and authorize user and product operations within the console itself. In this way, Sentry is a hybrid application that lives in the customer environment, but also has (and requires) access to the cloud.
Sentry Web
Sentry web provides primarily configuration capabilities available to users with the Sentry.Admin role. It does however also provide the ability to view job logs as well as drill down into individual logs to look at the details of the job, especially for jobs where alarms were triggered.
Sentry web provides similar capabilities to the command line with a few additional capabilities not available via the command line. Sentry web allows the administrator to:
- Create a datasource
- Create a notification
- Create and edit a job
- Create and edit an alarm
- Associate one or more alarms with a job
- View the job log
- Visualize alarms triggered over time
- Visualize the details of a alarms triggered within an alarm
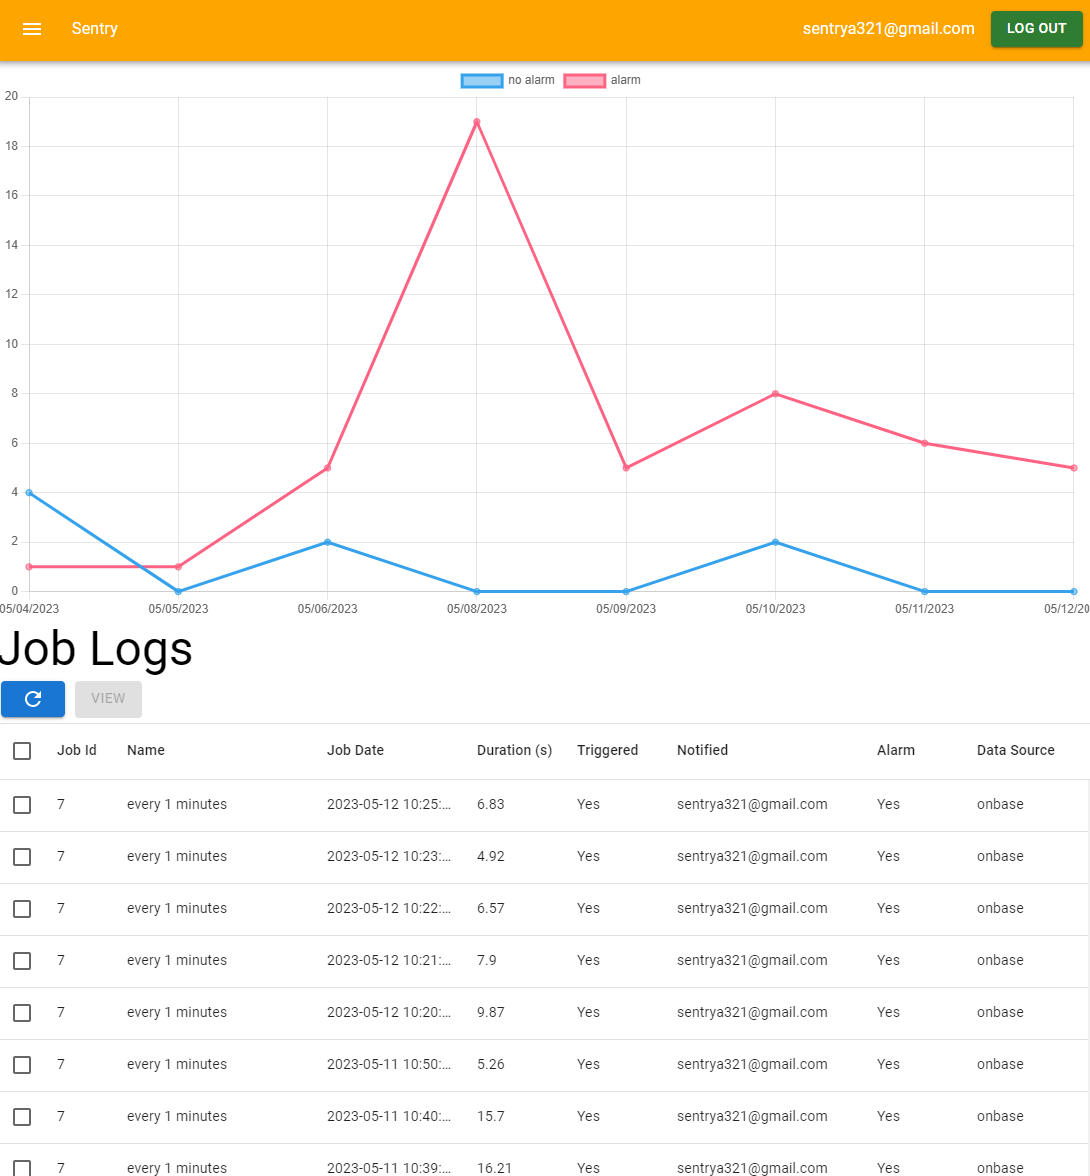
Job Logs
The following is an example of the job log summary:
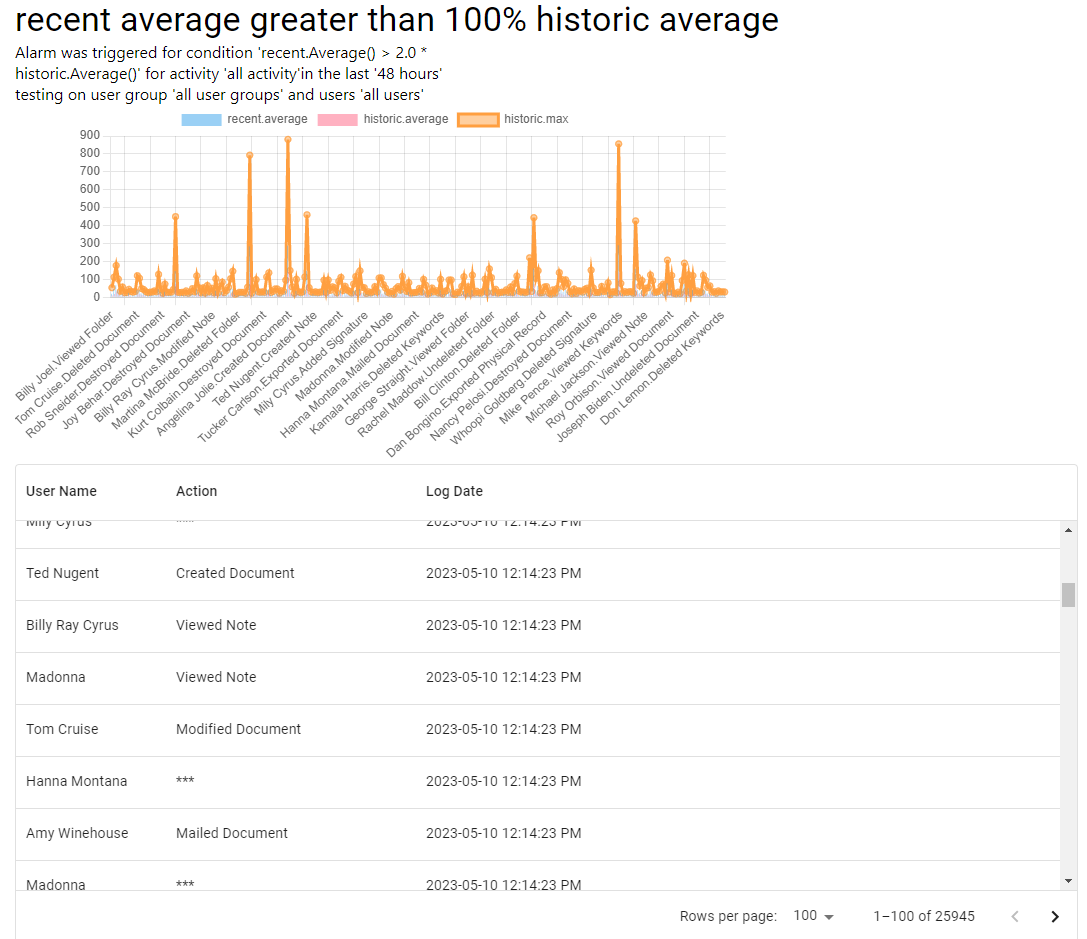
Job Details
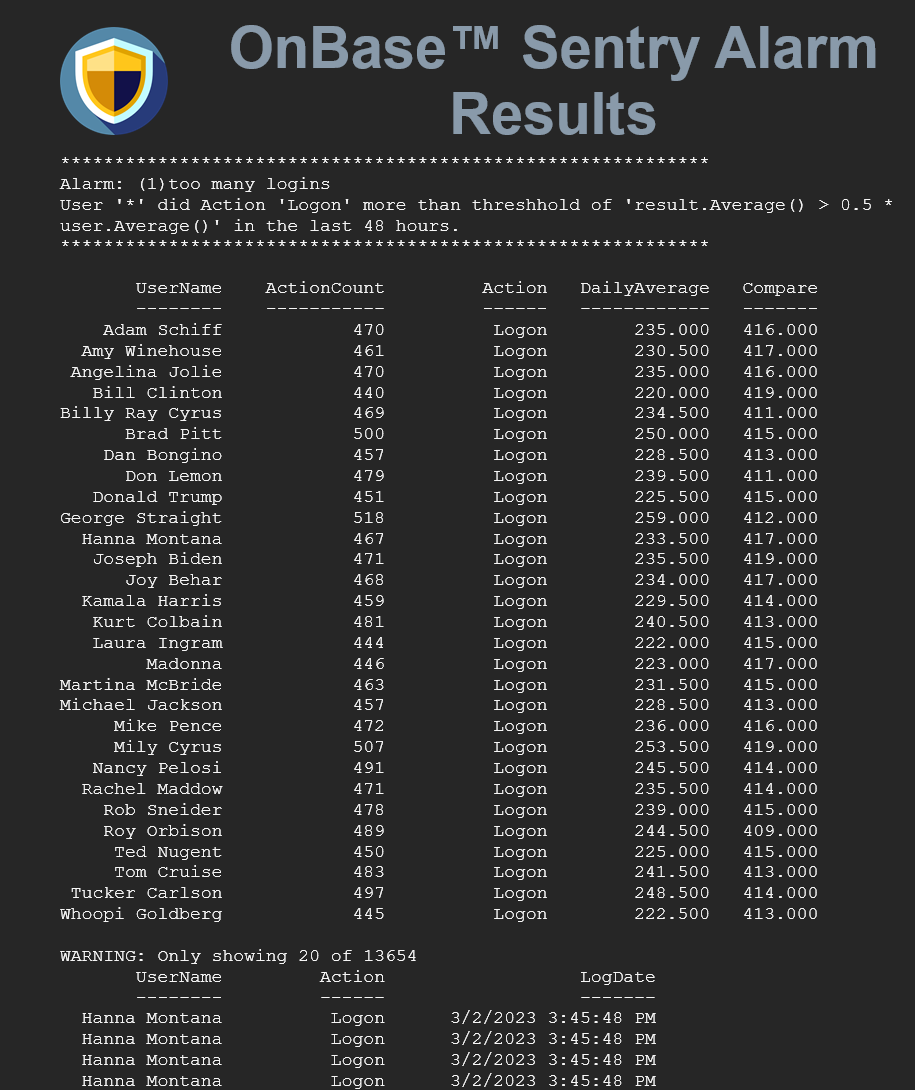
The following are a few examples of alarm details. These same details are also available in the notification e-mails, but are visualized within the Sentry web as well for historical purposes.

Expression Syntax
This section goes into more detail on the expression syntax used within alarm conditions. Conditions are configured on alarms that are represented by an expression that evaluates to either true or false. If the expression evaluates to true, then the condition is considered triggered for the alarm. If the expression evaluates to false, then the condition is considered not triggerred and no further action is taken.
The main objects represented in the expression are recent and history. The recent object represents the statistics for the current period as configured in the alarm. For example, if the alarm was configured for a period of 48 hours, the statistics collected under recent are only for that period.
The historic object represents the statistics collected during theuse of the updatestatistics command via the command line interface:
sentrycli.exe updatestatistics --days 90
As you can see from the above command, the historic statistics period should always be larger than the recent comparison period. It is important to note that both the recent and historic object are both the same type of object, only they represent different periods of data. Another important item of note is that when evaluating the expression, each represents a single user/action activity. For example, a Logon action for user Hannah Montana. So when comparing recent to historic values for the expression, you are comparing a single user/action pair.
Aggregates
With that said, both have the same properties. These include:
- Max - this represents the maximum value for the given user action for any given day during the period.
- Average - this represents the average daily activity for the given user action during the period.
- Count - this represents the total count of the user action across the entire period.
- Percentage - this represents the percentage of the user action as a total of all user actions for a given user over a given period.
Example
Before we go further, an example is warranted explaining the above properties. Let's assume statistics were calculated for a 90 day period and an alarm was configured for a period of 2 days (48 hours). For the purpose of this example, let's focus on a single user Hanna Montana with a single action Viewed Document. Over the two day period, Hanna views 100 documents. On the first day she views 60 documents and on the second day she views 40 documents. In addition her only other activity is logging in or Logon which she did twice, once for each of the two days. In this example, recent.Max would evaluate to 60 since that was the maximum value for that given action for any given day during the two day period. recent.Average would evaluate to 50 since she viewed 100 documents over a two day period for an average of 50 per day. recent.Count would evaluate to 100 since the total count of the viewed action is 100 over the two day period. Finally recent.Percentage is 0.98039 (or 98.039%) since she performed a total of 102 actions -- 100 views and 2 logins -- over the course of the period. Values for historic would be represented similarly only that the period would not be 2 days as in the alarm, but typically much larger such as 60 or 90 days.
Daily Activity
In addition to Max, Average, Count, and Percentage, recent and historic also have daily aggregates calculated over their respective periods representing each of the days of the week and one for the weekend. Specifically, Sunday, Monday, Tuesday, Wednesday, Thursday, Friday, Saturday, Sunday, and Weekend. Each of these in turn has a property of Average, Count, and Percentage. For example, recent.Sunday.Average would be the average activity for all Sundays during the recent period. recent.Sunday.Count would be the total count for give given activity across all Sundays during the recent period. recent.Sunday.Percentage would the the percentage of the given activity compared to other days within that period. There are a couple important items of note here. Since the recent period may not contain an entire week, some of these values may be zero. For example, if you are evaluating across a 48 hour period and running a job every two days, the expression for some of these will evaluate to zero. In this way, it is important to pair the period within the alarm with the period of the job. If you are monitoring daily activity your job should run at most once a week and include a period of seven days when configuring the alarm. You will also note that the days do not currently contain a value for Max.
Hourly Activity
The expression syntax also supports hourly activity although this gets a little more involved. Hourly activity involves nested expressions that provide additional context when evaluating the condition for the alarm. The following methods are available on recent and historic:
- HourlyCount(/expression/) - provides the hour and count within the nested expression. For example, recent.HourlyCount("hour < 7 && count > 0") would evaluate to true if the time was any time before 6am with any activity greater than zero.
- HourlyAverage(/expression/) - similar to the above but instead of count provides a context of average.
- HourlyPercentage(/expression/) - similar to the above but instead of count provides a context of percentage. It is important to note that in this context the percent is the percentage of the given user activity for a given action across the twenty four hour period. For example, if the user performs all of their activities equally during the hours of noon, 1p, 2p, and 3p then you would see something like .25 (or 25%) for each of those hours.
Hourly Comparisons
You'll note in the above section Hourly Activity that the expressions are available on both recent and historic but that there is no way of comparing recent and historic hours relative to each other. The following methods provide for this:
- CompareHourlyCounts(comparison,/expression/)
- CompareHourlyAverages(comparison,/expression/)
- CompareHourlyPercentages(comparison,/expression/)
The syntax for each of these is similar. For example: recent.CompareHourlyAverages(historic,"hour < 7 && recent > 1.2 * historic") compares the recent period to the historic period and evaluates to true if the hour is less than 6a and the recent average is greater than 20% (1.2x) the historic average. In this expression, recent and historic within the nested expression represent the average. Similarly for the Counts and Percentages versions of these methods recent and historic in the nested expression represent the count and percentage, respectfully.
Practical Examples
This section provides a few additional examples to demonstrate some of the power of the expression syntax. recent.Count > 0 detects any activity for a given user action. recent.Weekend.Count > 0 detects any activity for a given user action on the weekend. recent.HourlyCount("hour < 7 || hour > 18 && count > 0") detects any activity for a given user action outside of business hours recent.Average > 1.2 * historic.Average detects any activity for a given user action that is 20% greater than the historic activity for that user action. These can also be combined. For example, to detect any activity outside of business hours or on the weekend or outside of the average, you might do recent.Weekend.Count > 0 || recent.HourlyCount("hour < 7 || hour > 18 && count > 0") || recent.Average > 1.2 * historic.Average.
Database Performance
There are three primary operations performed against the OnBase database that may affect performance of the OnBase system that should be monitored closely. The first is the update of the historical statistics. This query selects all log rows for both securitylog and transactionxlog for the given period. For examples if statistics are updated for a 90 day period, then all rows will be selected and traversed. The rows are however traversed and processed in memory one at a time and an operation against even 10m rows can take less than a minute. It is important that the agent has fast network connectivity to the database server so that this operation can be performed in a timely fashion. Similarly, when each job is executed, the agent calculates statistics for a recent period. This is less taxing since it is only retrieving rows for a smaller sample such as a few days or a week. However, if jobs run frequently, this operation will occur more than an update of historical statistics which will only occur once every 60 or 90 days. Finally, when an alarm is triggered, Sentry retrieves all of the candidate rows that may have triggered the alarm in the recent period. So if for example, the period was configured for 48 hours, the rows for the last 48 hours would have been retrieved that meet the criteria. For example, if the user action Logon was triggered by user Hanna Montana, then all logon activity by Hanna for the configured period will be retrieved. This operation performs a join across three separate tables: hsi.useraccount, hsi.securitylog (or) hsi.transactionxlog, and sentry.logtexts. To optimize this operation, both hsi.securitylog and hsi.transactionxlog will not only need an index on the date column but also on the usernum, actionnum, and subactionnum, per the following:
CREATE NONCLUSTERED INDEX
IDX_sentry_securitylog_1
ON hsi.securitylog(logdate)
INCLUDE (usernum,actionnum,subactionnum)
Also for hsi.transactionxlog:
CREATE NONCLUSTERED INDEX
IDX_sentry_transactionxlog_1
ON hsi.transactionxlog(logdate)
INCLUDE (usernum,actionnum,subactionnum)
Note that these indexes are not created by the Sentry application as the application will not make direct changes to the hsi schema or any related objects or indexes.
Plugins
Sentry currently supports the use of a single plugin that has the ability to accept a job log of a completed job that has raised one or more alarms. The Sentry agent orchestrates the transmission of the log object to the plugin.
The plugin takes the form of a command line executable that accepts input through STDIN. A JSON object is serialized and forwarded to the executable via STDIN. The event takes the form of:
{
	"EventName" : "<name>",
	"Data" : <JSON data>
}
Currently the only valid event name is onJobComplete.
The plugin executable and all of its dependencies should be placed within the \plugin folder under the Sentry application data folder for the current Roaming user. The location would typically look like the following:
c:\users\<username>\AppData\Roaming\Evolution Advisers\Sentry\plugins
If an executable exists in that directory, the Sentry agent will detect it, and forward along job information as it occurs.
The job information is contained in a local database table that is created on Sentry startup called sentry.joblog. Sentry uses this as the queuing mechanism to pass data along to the plug.
If the plugin runs and throws an exception or returns with anything but an exit code of zero, Sentry will also mark that message as an error and log any relevant exception messaging or stack traces.
sentry.joblog table
The following is the structure of the sentry.joblog table. Note that the plugin need not interact with this table. It is only listed here for reference purposes. The Sentry agent itself orchestrates the pushing of the job log to the plugin.
| Column Name | Data Type | Meaning |
|---|---|---|
| localid | BIGINT | local identifier for the row |
| jobid | BIGINT | the id of the job |
| logid | BIGINT | the log id of the log entry for the job |
| procstatus | VARCHAR | the process status used to track the processing by the pluging, valid values include Pending, Exporting, Exported, and Error |
| exmessage | VARCHAR | an exception message if an exception were to occur |
| extrace | VARCHAR | a stack trace if a stack trace is available |
JSON Data Format
The format of the Data node for the event object listed above appears as follows:
LogEntry
|--->Array of Results (each has)
	|--->Job
	|--->Alarm
	|--->Samples
	|--->RecentStatistics
	|--->Comparisons

{
  "LogEntry": {
    "LogId": 180,
    "OrganizationId": 0,
    "JobId": 7,
    "JobName": "every 1 minutes",
    "JobDate": "2023-06-01T17:49:55.9643772+00:00",
    "Duration": 6.902252,
    "IsTriggered": 1,
    "Notified": "sentrya321@gmail.com",
    "RaisedAlarm": 1,
    "DataSourceName": "onbase",
    "FileName": "04e27898-640c-4aea-a57a-bfa5b45f9906.json"
  },
  "Results": [
    {
      "RowsEvaluated": 0,
      "ExceptionMessage": "",
      "StackTrace": "",
      "Job": {
        "JobId": 7,
        "OrganizationId": 12,
        "JobName": "every 1 minutes",
        "FrequencyType": 0,
        "Every": 1,
        "AtTime": null,
        "OnDay": null,
        "LastExecuted": "2023-06-01T17:48:47.858918Z",
        "NotificationId": 4
      },
      "Alarm": {
        "AlarmId": 34,
        "OrganizationId": 12,
        "AlarmName": "No View Activity By User",
        "UserGroup": "*",
        "UserName": "*",
        "Action": "Viewed Document",
        "Condition": "recent.Count == 0",
        "Period": 24
      },
      "Samples": [],
      "RecentStatistics": [
        {
          "StatisticId": 0,
          "UserName": "Hanna Montana",
          "Action": "Viewed Document",
          "Max": 0,
          "Percentage": 0,
          "Average": 0,
          "Count": 0,
          "H0": 0,
          "H1": 0,
          "H2": 0,
		  ** Rest Omitted for Brevity
          "A0": 0,
          "A1": 0,
          "A2": 0,
          "A3": 0,
		   ** Rest Omitted for Brevity
          "P0": 0,
          "P1": 0,
          "P2": 0,
          "P3": 0,
		   ** Rest Omitted for Brevity
        },
      ],
      "Comparisons": [
        {
          "Recent": {
            "StatisticId": 0,
            "UserName": "Willie Nelson",
            "Action": "Viewed Document",
            "Max": 0,
            "Percentage": 0,
            "Average": 0,
            "Count": 0,
            "H0": 0,
            "H1": 0,
            "H2": 0,
            "H3": 0,
			** Rest Omitted for Brevity
            "A0": 0,
            "A1": 0,
            "A2": 0,
            "A3": 0,
			** Rest Omitted for Brevity
            "P0": 0,
            "P1": 0,
            "P2": 0,
            "P3": 0,
			** Rest Omitted for Brevity
          },
          "Historic": {
            "StatisticId": 0,
            "UserName": "Willie Nelson",
            "Action": "Viewed Document",
            "Max": 116,
            "Percentage": 0.004,
            "Average": 14.768,
            "Count": 827,
            "H0": 0,
            "H1": 0,
            "H2": 0,
            "H3": 0,
			** Rest Omitted for Brevity
            "A0": 0.000,
            "A1": 0.000,
            "A2": 0.000,
            "A3": 0.000,
			** Rest Omitted for Brevity
            "P0": 0.000,
            "P1": 0.000,
            "P2": 0.000,
            "P3": 0.000,
			** Rest Omitted for Brevity
          }
        },
      ]
    },